Bitcoin’s price action remained stagnant over the weekend, suggesting that both bulls and bears are cautious about the next move. However, this consolidation phase is usually followed by an increase in volatility. Meanwhile, altcoins SHIB, UNI, OKB, and HBAR are showing bullish signs.
Bitcoin Price Analysis
Bitcoin’s price has been squeezed between the 20-day exponential moving average ($29,430) and the horizontal support at $28,861. If the price falls below the $28,861-to-$28,585 support zone, Bitcoin could move downward to $26,000. Conversely, if the price rebounds and breaks above the 50-day simple moving average ($29,840), it could signal recovery to the overhead resistance zone between $31,804 and $32,400.
Shiba Inu Price Analysis
Shiba Inu broke and closed above the overhead resistance of $0.0000085 on Aug. 4, indicating a potential new uptrend. If the price breaks above $0.000010, the pair may surge to $0.000012 and then to $0.000014. A break below the 61.8% Fibonacci retracement level of $0.000009 could lead to a potential fall to $0.0000085.
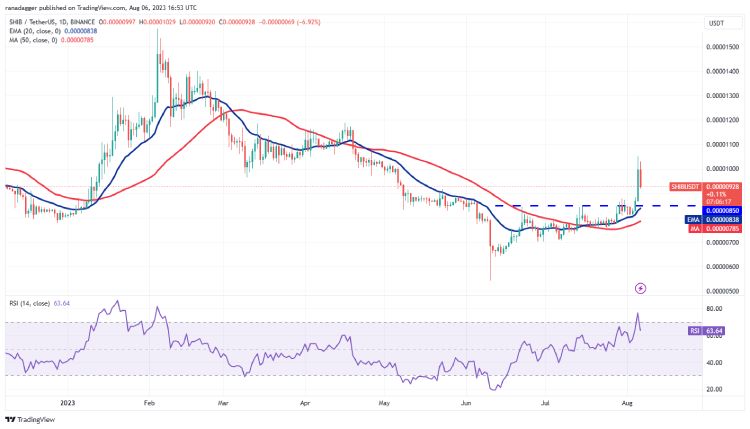
SHIB/USDT daily chart. Source: TradingView
Uniswap Price Analysis
Uniswap has been in a correction, but bulls are trying to arrest the decline near the 20-day EMA ($6.04). If the price rebounds with strength, the UNI/USDT pair could first rise to $6.70, and if this level is crossed, the next target could be $7.50. However, if the price sustains below the 20-day EMA, it could descend to the 50-day SMA ($5.58).

UNI/USDT daily chart. Source: TradingView
OKB Price Analysis
OKB has been falling inside a large range between $38 and $59 for several weeks. However, the price was pushed above the downtrend line on Aug. 4, indicating a potential ending of the short-term downtrend. If the price goes to $48 and then $50, the pair could quickly jump to $54. A slide below the downtrend line could lead to a slump to $41.

OKB/USDT daily chart. Source: TradingView
Hedera Price Analysis
Hedera broke above the overhead resistance of $0.055 on Aug. 6, suggesting that bulls are attempting a comeback. If buyers sustain the price above $0.055, the pair could first rise to $0.065 and then attempt a rally to $0.075. A drop below the 50-day SMA ($0.05) could sink the pair to $0.045.

HBAR/USDT daily chart. Source: TradingView
Source: Cointelegraph